

Question: A CVP graph such as the one shown below is a useful technique for showing relationships among an organizations costs, volume, and profits. Required: 1.
A CVP graph such as the one shown below is a useful technique for showing relationships among an organization’s costs, volume, and profits.
Required:
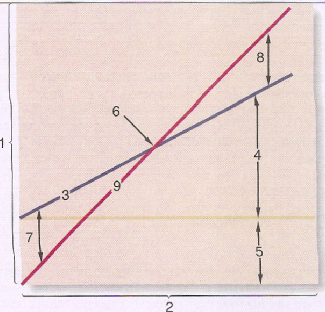
1. Identify the numbered components in the CVP graph.
2. State the effect of each of the following actions on line 3, line 9, and the break-even point. For line 3 and line 9, state whether the action will cause the line to:
Remain unchanged.
Shift upward.
Shift downward.
Have a steeper slope (i.e., rotate upward).
Have a flatter slope (i.e., rotate downward).
Shift upward and have a steeper slope.
Shift upward and have a flatter slope.
Shift downward and have a steeper slope.
Shift downward and have a flatter slope.
In the case of the break-even point, state whether the action will cause the break-even point to:
Remain unchanged.
Increase.
Decrease.
Probably change, but the direction is uncertain.
Treat each case independently.
x. Example. Fixed costs are reduced by $5,000 per period.
Answer (see choices above): Line 3: Shift downward.
Line 9: Remain unchanged.
Break-even point: Decrease.
a. The unit selling price is increased from $18 to $20.
b. Unit variable costs are decreased from $12 to $10.
c. Fixed costs are increased by $3,000 per period.
d. Two thousand more units arc sold during the period than were budgeted.
e. Due to paying salespersons a commission rather than a flat salary, fixed costs are reduced by $8,000 per period and unit variable costs arc increased by $3.
f. Due to an increase in the cost of materials, both unit variable costs and the selling price are increased by $2.
g. Advertising costs are increased by $10,000 per period, resulting in a 10% increase in the number of units sold.
h. Due to automating an operation previously done by workers, fixed costs are increased by $12,000 per period and unit variable costs are reduced by $4.
8. 2. 7.
Step by Step Solution
3.20 Rating (158 Votes )
There are 3 Steps involved in it
1 1 Dollars 2 Volume of output expressed in units of capacity sales or some other measure 3 Total ex... View full answer

Get step-by-step solutions from verified subject matter experts
Document Format (1 attachment)
25-B-M-A-C-V-P (29).docx
120 KBs Word File