

A Gallup poll conducted in 2011 asked respondents why they would not consider buying a hybrid car
Question:
A Gallup poll conducted in 2011 asked respondents why they would not consider buying a hybrid car for their next purchase. The results are shown in the following table. Suppose Toyota would like to confirm these results with its own survey, so the company asked 300 people the same question. The results of Toyota’s survey are also shown in the following table:
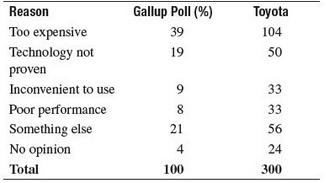
a. Using α = 0.05, determine if the observed frequencies in the Toyota survey are consistent with the results from the Gallup poll.
b. Determine the p-value using Excel and interpret its meaning.
Fantastic news! We've Found the answer you've been seeking!
Step by Step Answer:
a H 0 A set of observed frequencies of the reasons not buying a hybrid car in Toyota surv...View the full answer

Answered By
Shameen Tahir
The following are details of my Areas of Effectiveness. The following are details of my Areas of Effectiveness English Language Proficiency, Organization Behavior , consumer Behavior and Marketing, Communication, Applied Statistics, Research Methods , Cognitive & Affective Processes, Cognitive & Affective Processes, Data Analysis in Research, Human Resources Management ,Research Project,
Social Psychology, Personality Psychology, Introduction to Applied Areas of Psychology,
Behavioral Neurosdence , Historical and Contemporary Issues in Psychology, Measurement in Psychology, experimental Psychology,
Business Ethics Business Ethics An introduction to business studies Organization & Management Legal Environment of Business Information Systems in Organizations Operations Management Global Business Policies Industrial Organization Business Strategy Information Management and Technology Company Structure and Organizational Management Accounting & Auditing Financial Accounting Managerial Accounting Accounting for strategy implementation Financial accounting Introduction to bookkeeping and accounting Marketing Marketing Management Professional Development Strategies Business Communications Business planning Commerce & Technology Human resource management General Management Conflict management Leadership Organizational Leadership Supply Chain Management Law Corporate Strategy Creative Writing Analytical Reading & Writing Other Expertise Risk Management Entrepreneurship Management science Organizational behavior Project management Financial Analysis, Research & Companies Valuation And any kind of Excel Queries.
16+ Reviews
34+ Question Solved
Related Book For 

Question Posted:
