

A Gallup poll conducted in 2012 asked people who were not rich whether they thought it was
Question:
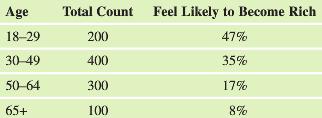
A Gallup poll conducted in 2012 asked people who were not rich whether they thought it was likely that they would become rich. The table gives the total number of people in each age range (rounded) and the percent who said they were likely to become rich.
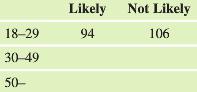
a. Make a two-way table of counts (not percentages). The table is started below.
b. What is the tendency? Which group was most likely to think they might become rich, and which group was least likely to think they might become rich? Does this make sense to you?
c. From your table, if one person is selected from the table, what is the probability that this person is young (18€“29) AND thinks it is likely that she or he will become rich.
d. If you select a person from the people who think it is likely that she or he will become rich, what is the probability that this person is young (18€“29)?
e. If you select a young person (18€“29), what is the probability that this person thinks it is likely they she or he will become rich?
f. Why is the probability in part c smaller than those in parts d and e?
Step by Step Answer:
a Age Likely Not Likely Total 1829 04720094 053200106 200 3049 035400140 ...View the full answer


Introductory Statistics Exploring The World Through Data
ISBN: 9780321978271
2nd Edition
Authors: Robert Gould, Colleen Ryan
