

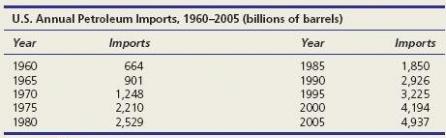
(a) Plot U.S. petroleum imports on a graph. (b) Describe the trend (if any) and discuss possible...
Question:
(b) Describe the trend (if any) and discuss possible causes.
(c) Fit both a linear and an exponential trend.
(c) Interpret each fitted trend equation, explaining the implications.
(d) Make a projection for 2010. Do you believe it?
(e) To whom is this issue relevant? Note: Time increments are 5 years, so use t = 11 for the 2010 forecast.
Fantastic news! We've Found the answer you've been seeking!
Step by Step Answer:
a b We see an overall increasing trend in imports Fuel consumption ...View the full answer

Answered By
ANDREW KIPRUTO
Academic Writing Expert
I have over 7 years of research and application experience. I am trained and licensed to provide expertise in IT information, computer sciences related topics and other units like chemistry, Business, law, biology, biochemistry, and genetics. I'm a network and IT admin with +8 years of experience in all kind of environments.
I can help you in the following areas:
Networking
- Ethernet, Wireless Airmax and 802.11, fiber networks on GPON/GEPON and WDM
- Protocols and IP Services: VLANs, LACP, ACLs, VPNs, OSPF, BGP, RADIUS, PPPoE, DNS, Proxies, SNMP
- Vendors: MikroTik, Ubiquiti, Cisco, Juniper, HP, Dell, DrayTek, SMC, Zyxel, Furukawa Electric, and many more
- Monitoring Systems: PRTG, Zabbix, Whatsup Gold, TheDude, RRDtoo
Always available for new projects! Contact me for any inquiries
1+ Reviews
10+ Question Solved
Related Book For 

Applied Statistics In Business And Economics
ISBN: 9780073521480
4th Edition
Authors: David Doane, Lori Seward
Question Posted:
