

A paper by R. N. Rodriguez (Health Care Applications of Statistical Process Control: Examples Using the SAS
Question:
A paper by R. N. Rodriguez (“Health Care Applications of Statistical Process Control: Examples Using the SAS® System,”, SAS Users Group International: Proceedings of the 21st Annual Conference, 1996) illustrated several informative applications of control charts to the health care environment. One of these showed how a control chart was employed to analyze the number of office visits by health care plan members. The data for clinic E are shown in table 6E.17. The variable NVISITE is the number of visits to clinic E each month, and MMSE is the number of members enrolled in the health care plan each month, in units of member months. “Days” is the number of days in each month. The variable NYRSE converts MMSE to units of thousand members per year and is computed as follows:  NYRSE represents the “area of opportunity.” The variable Phase separates the data into two time periods.
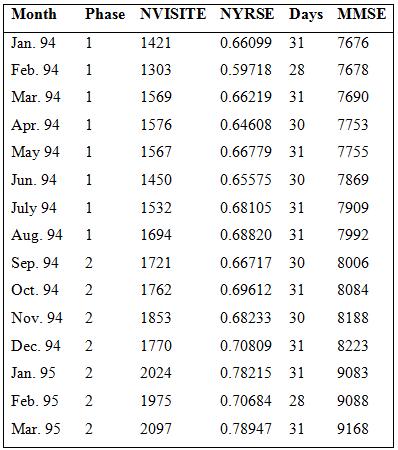
The variable can be thought of as an “inspection unit”, representing an identical “area of opportunity” for each “sample”. The “process characteristic” to be controlled is the rate of clinic visits. A u chart which monitors the average number clinic visits per
  is appropriate.
a. Use the data from P1 to construct a control chart for monitoring the rate of office visits performed at clinic E. Does this chart exhibit control?
b. Plot the data from P2 on the chart constructed in part (a). Is there a difference in the two phases?
c. Consider only the P2 data. Do these data exhibit control?
Step by Step Answer:
a MTB Stat Control Charts Attributes Charts U The process is in control b MTB Stat Cont...View the full answer


Managing Controlling and Improving Quality
ISBN: 978-0471697916
1st edition
Authors: Douglas C. Montgomery, Cheryl L. Jennings, Michele E. Pfund
