

AmcrPlas, Inc., produces 20-ounce plastic drinking cups that are embossed with the names of prominent beers and
Question:
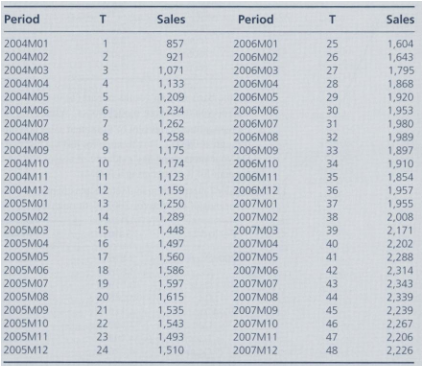
a. Use these data to estimate a linear time trend as follows:
SALES = a + b (T)
SALES = _______ +/- _______ (7")
(Circle + or €“ as appropriate)
Do your regression results support the notion that there has been a positive time trend in the SALES data? Explain.
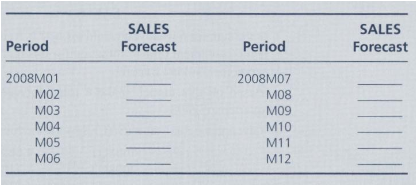
b. Use your equation to forecast SALES for the 12 months of 2008:
c. Actual SALES for 2008 are:
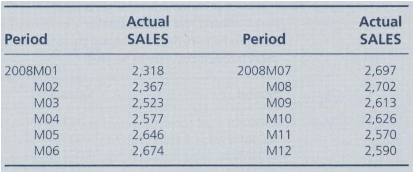
On the basis of your results in part (b) in comparison with these actual sales, how well do you think your model works? What is the RMSE for 2008?
d. Prepare a time-series plot of the actual sales and the forecast of sales for 2004M01 through 2008M12. Do the same for just the last two years (2007M01 to 2008M12). Do your plots show any evidence of seasonality in the data? If so, how might you account for it in preparing a forecast?
Step by Step Answer:
tr msoheightsourceauto col msowidthsourceauto br msodataplacementsamecell style0 msonumberformatGeneral textaligngeneral verticalalignbottom whitespacenowrap msorotate0 msobackgroundsourceauto msopatt...View the full answer


Business Forecasting with Forecast X
ISBN: 978-0073373645
6th edition
Authors: Holton wilson, barry keating, john solutions inc
