

An airline plans to initiate service at an airport in a city of approximately 500,000 people. To
Question:
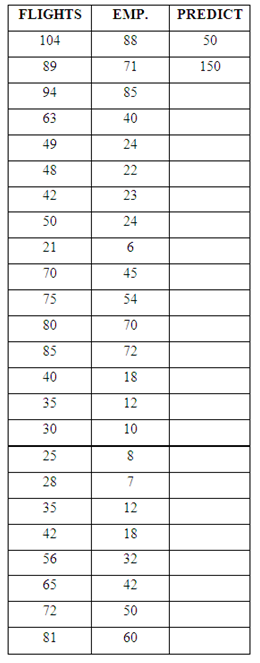
An airline plans to initiate service at an airport in a city of approximately 500,000 people. To determine staffing requirements, officials for the airline take advantage of the sample survey data on the relationship between the number of flights per week and the number of employees for 30 airlines at various airports in cities that are similar in size (approximately 300,000 to 700,000). The data is found below.
Regression Analysis: EMP. versus FLIGHTS
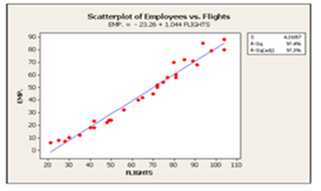
The regression equation is
EMP. = - 23.3 + 1.04 FLIGHTS
Predictor Coef SE Coef T P
Constant -23.261 2.177 -10.68 0.000
FLIGHTS 1.04407 0.03202 32.60 0.000
S = 4.31057 R-Sq = 97.4% R-Sq(adj) = 97.3%
Analysis of Variance
Source DF SS MS F P
Regression 1 19752 19752 1063.00 0.000
Residual Error 28 520 19
Total 29 20272
Predicted Values for New Observations
New Obs Fit SE Fit 95% CI 95% PI
1 28.943 0.896 ( 27.107, 30.779) ( 19.924, 37.961)
2 133.350 2.883 (127.445, 139.255) (122.728, 143.973)XX
XX denotes a point that is an extreme outlier in the predictors.
Values of Predictors for New Observations
New .........Obs FLIGHTS
1.........................50
2.......................150
Correlations: FLIGHTS, EMP.
Pearson correlation of FLIGHTS and EMP. = 0.987
P-Value = 0.000
a. Analyze the above output to determine the regression equation.
b. Find and interpret βˆ1 in the context of this problem.
c. Find and interpret the coefficient of determination (r-squared).
d. Find and interpret coefficient of correlation.
e. Does the data provide significant evidence (α = .05) that the number of flights can be used to predict the number of employees? Test the utility of this model using a two-tailed test. Find the observed p-value and interpret.
f. Find the 95% prediction interval for the number of employees needed for an airline that has 50 flights per week. Interpret this interval.
g. Find the 95% confidence interval for the mean number of employees needed for airlines that have 50 flights per week. Interpret this interval.
h. What can we say about the number of employees needed for an airport that has 150 flights per week?
Step by Step Answer:
a Here the regression equation is EMP 233 104 FLIGHTS b Here the obtained 1 is 104407 which tells us per 1 unit increment in flight number leads to 10...View the full answer


Smith and Roberson Business Law
ISBN: 978-0538473637
15th Edition
Authors: Richard A. Mann, Barry S. Roberts
