

Occasionally an investigator may wish to compute a confidence interval for a, the y intercept of the
Question:
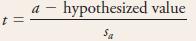
Occasionally an investigator may wish to compute a confidence interval for a, the y intercept of the true regression line, or test hypotheses about a. The estimated y intercept is simply the height of the estimated line when x = 0, since a 1 b(0) = a. This implies that sa the estimated standard deviation of the statistic a, results from substituting x* = 0 in the formula for sa1bx*. The desired confidence interval is then 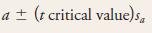
and a test statistic is
a. The article “Comparison of Winter-Nocturnal Geostationary Satellite Infrared-Surface Temperature with Shelter-Height Temperature in Florida” (Remote Sensing of the Environment [1983]: 313– 327) used the simple linear regression model to relate surface temperature as measured by a satellite (y) to actual air temperature (x) as determined from a thermocouple placed on a traversing vehicle. Selected data are given (read from a scatterplot in the article).
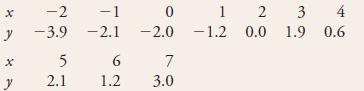
Estimate the population regression line.
b. Compute the estimated standard deviation sa. Carry out a test at level of significance .05 to see whether the y intercept of the population regression line differs from zero.
Step by Step Answer:
a The estimated regression line is y 1752 0685x where ...View the full answer


Statistics The Exploration & Analysis Of Data
ISBN: 9780840058010
7th Edition
Authors: Roxy Peck, Jay L. Devore
