

Assume that the following marginal costs exist in catfish production: (a) Graph the MC curve. (b) Use
Question:
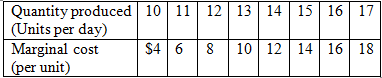
Assume that the following marginal costs exist in catfish production:
(a) Graph the MC curve.
(b) Use the data on market demand below and graph the demand and MR curves on the same graph.
Price (per unit) ........................................... $25 24 23 22 21 20 19 18
Quantity demanded (units per day) ..............10 11 12 13 14 15 16 17
(c) At what rate of output is MR = MC?
(d) What price will a monopolist charge for that much output?
(e) If the market were perfectly competitive, what price would prevail?
(f) How much output would be produced?
Fantastic news! We've Found the answer you've been seeking!
Step by Step Answer:
a and b Price Per unit 25 24 23 22 21 20 19 18 Quantity demanded Units per day 10 11 12 13 14 15 16 17 Total revenue 250 264 276 286 294 300 304 306 M...View the full answer

Answered By
Umber Talat
I am providing full time mentoring and tutoring services in Business Finance, Contemporary issue in Global Economy, Quantitative Techniques, Principles of Marketing, strategic marketing, International Marketing, Organizational Behavior (OB), Consumer Behavior, Sales Force Management, Strategic Brand Management, Services Marketing, Integrated Marketing Communication (IMC), Principles of Management, General Management, Strategic Management, Small and Medium Enterprise Management, Innovation Management, Change Management, Knowledge Management, Strategic Planning, Operations Management, Supply Chain Management, Logistics Management, Inventory management, Total Quality Management (TQM), Productions Management, Project Management, Production Planning, Human Resource Management (HRM), Human Resource Development, Strategic HRM, Organizational Planning, Performance and Compensation Management, Recruitment and Selection, Organizational Development, Global Issues in Human Resource Management, Retail Marketing, Entrepreneurship, Entrepreneurial Marketing, International Business, Research Methods in Business, Business Communication, Business Ethics.
158+ Reviews
236+ Question Solved
Related Book For 

Question Posted:
