

The net weight of a soft drink is to be monitored by and R control charts using
Question:
The net weight of a soft drink is to be monitored by ![]() and R control charts using a sample size of n = 5. Data for 20 preliminary samples are shown in Table 5E.2.
and R control charts using a sample size of n = 5. Data for 20 preliminary samples are shown in Table 5E.2.
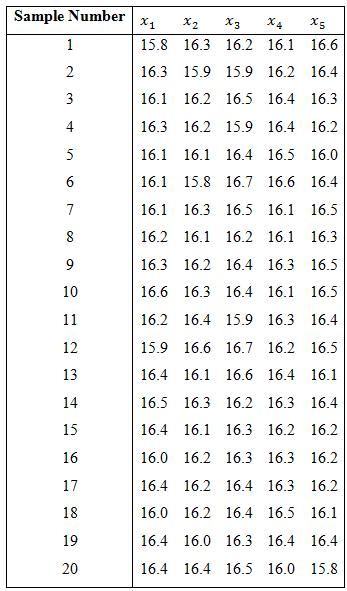
a. Set up ![]() and R control charts using these data. Does the process exhibit statistical control?
and R control charts using these data. Does the process exhibit statistical control?
b. Estimate the process mean and standard deviation.
c. Does fill weight seem to follow a normal distribution?
Fantastic news! We've Found the answer you've been seeking!
Step by Step Answer:
a MTB Stat Control Charts Variables Charts for Subgroups XbarR The proc...View the full answer

Answered By
Sandhya Sharma
I hold M.Sc and M.Phil degrees in mathematics from CCS University, India and also have a MS degree in information management from Asian institute of technology, Bangkok, Thailand. I have worked at a international school in Bangkok as a IT teacher. Presently, I am working from home as a online Math/Statistics tutor. I have more than 10 years of online tutoring experience. My students have always excelled in their studies.
119+ Reviews
214+ Question Solved
Related Book For 

Managing Controlling and Improving Quality
ISBN: 978-0471697916
1st edition
Authors: Douglas C. Montgomery, Cheryl L. Jennings, Michele E. Pfund
Question Posted:
