

Below are the tables you analyzed with chi square in problem 10.16. As you recall, these are
Question:
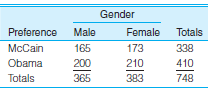
a. Presidential preference and gender:
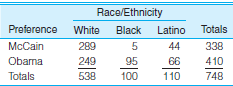
b. Presidential preference and race/ethnicity:
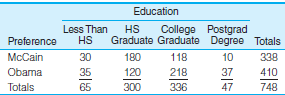
c. Presidential preference by education:
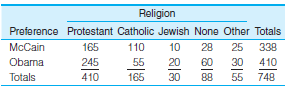
d. Presidential preference by religion:
Fantastic news! We've Found the answer you've been seeking!
Step by Step Answer:
a Maximum difference 003 Phi 000 Lambda 000 b ...View the full answer

Answered By
Zablon Gicharu
I am an educator who possesses the requisite skills and knowledge due to interacting with students for an extended period. I provide solutions to various problems in step-by-step explanations, a well-thought approach and an understandable breakdown. My goal is to impart more straightforward methodologies and understanding to students for more remarkable achievements.
4+ Reviews
10+ Question Solved
Related Book For 
The Essentials Of Statistics A Tool For Social Research
ISBN: 9781111829568
3rd Edition
Authors: Joseph F. Healey
Question Posted:
