

Below is a less than or equal to cumulative relative frequency table showing the results of a
Question:
Below is a “less than or equal to” cumulative relative frequency table showing the results of a National Rifle Association survey of gun ownership in Oregon. The table is based on data collected from 2000 Oregon residents:
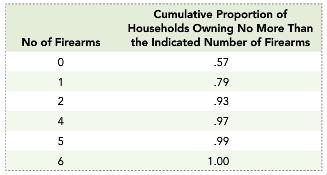
a. Show the relative frequency table that’s the basis of this “less than or equal to” cumulative relative frequency table.
b. Use the table you produced in part a to compute the mean, the variance and the standard deviation for the data shown here.
Fantastic news! We've Found the answer you've been seeking!
Step by Step Answer:
a Number of Firearms x Proportion of Households Owning the Indicated ...View the full answer

Answered By
ANDREW KIPRUTO
Academic Writing Expert
I have over 7 years of research and application experience. I am trained and licensed to provide expertise in IT information, computer sciences related topics and other units like chemistry, Business, law, biology, biochemistry, and genetics. I'm a network and IT admin with +8 years of experience in all kind of environments.
I can help you in the following areas:
Networking
- Ethernet, Wireless Airmax and 802.11, fiber networks on GPON/GEPON and WDM
- Protocols and IP Services: VLANs, LACP, ACLs, VPNs, OSPF, BGP, RADIUS, PPPoE, DNS, Proxies, SNMP
- Vendors: MikroTik, Ubiquiti, Cisco, Juniper, HP, Dell, DrayTek, SMC, Zyxel, Furukawa Electric, and many more
- Monitoring Systems: PRTG, Zabbix, Whatsup Gold, TheDude, RRDtoo
Always available for new projects! Contact me for any inquiries
1+ Reviews
10+ Question Solved
Related Book For 

Understanding Business Statistics
ISBN: 978-1118145258
1st edition
Authors: Stacey Jones, Tim Bergquist, Ned Freed
Question Posted:
