

Bender, Inc., produces industrial blenders for smoothie and health food shops. It has four peak periods, each
Question:
Bender, Inc., produces industrial blenders for smoothie and health food shops. It has four peak periods, each lasting 2 months, for manufacturing the merchandise suited for spring, summer, fall, and winter. In the off- peak periods, Bender schedules equipment maintenance. Bender’s controller, Gina Hood, wants to understand the drivers of equipment maintenance costs.
The data collected is as follows.
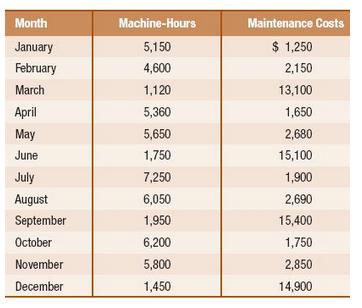
A regression analysis of 1 year of monthly data yields the following relationships:
Maintenance costs = $ 17,983 - ($ 2.683 * Number of machine@ hours)
Upon examining the results, Hood comments, “So, all I have to do to reduce maintenance costs is run my machines longer? This is hard to believe, but numbers don’t lie! I would have guessed just the opposite.”
Required
1. Explain why Hood made this comment. What is wrong with her analysis?
2. Upon further reflection, Hood reanalyzes the data, this time comparing quarterly machine- hours with quarterly maintenance expenditures. This time, the results are very different. The regression yields the following formula:
Maintenance costs = $ 8,580.20 + ($ 0.785 * Number of machine@ hours)
What caused the formula to change, in light of the fact that the data was the same?
Step by Step Answer:
1 Gina Hood is commenting about some surprising and economically implausible regression results In t...View the full answer


Managerial Accounting Decision Making and Motivating Performance
ISBN: 978-0137024872
1st edition
Authors: Srikant M. Datar, Madhav V. Rajan
