

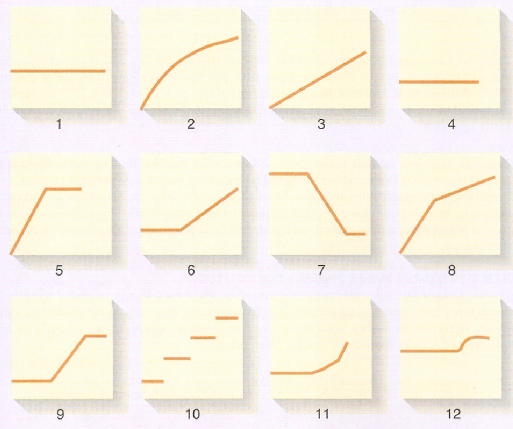
A number of graphs displaying cost behavior patterns are shown below. The vertical axis on each graph
Question:
A number of graphs displaying cost behavior patterns are shown below. The vertical axis on each graph represents total cost, and the horizontal axis represents level of activity (volume).
Required:
1. For each of the following situations, identify the graph below that illustrates the cost behavior pattern involved. Any graph may be used more than once.
a. Cost of raw materials used.
b. Electricity bill—a flat fixed charge, plus a variable cost after a certain number of kilowatt-hours are used.
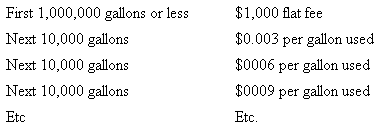
c. City water bill, which is computed as follows:
d. Depreciation of equipment, where the amount is computed by the straight-line method. When the depreciation rate was established, it was anticipated that the obsolescence factor would be greater than the wear and tear factor.
e. Rent on a factory building donated by the city, where the agreement calls for a fixed fee payment unless 200,000 labor-hours or more are worked, in which case no rent need be paid.
f. Salaries of maintenance workers, where one maintenance worker is needed for every 1,000 hours of machine-hours or less (that is, 0 to 1,000 hours requires one maintenance worker, 1.001 to 2,000 hours requires two maintenance workers, etc.).
g. Cost of raw materials, where the cost starts at $7.50 per unit and then decreases by 5 cents per unit for each of the first 100 units purchased, after which it remains constant at $2.50 per unit.
h. Rent on a factory building donated by the county, where the agreement calls for rent of $100,000 less $1 for each direct labor-hour worked in excess of 200,000 hours, but a minimum rental payment of $20,000 must be paid.
i. Use of a machine under a lease, where a minimum charge of $1,000 is paid for up to 400 hours of machine time. After 400 hours of machine time, an additional charge of $2 per hour is paid up to a maximum charge of $2,000 per period.
2. How would a knowledge of cost behavior patterns such as those above be of help to a manager in analyzing the cost structure of his or her company?
Step by Step Answer:
1 a 3 c 11 e 4 g 2 i 9 b 6 d 1 f 10 h 7 2 Without an un...View the full answer


Managerial Accounting
ISBN: 978-0697789938
13th Edition
Authors: Ray H. Garrison, Eric W. Noreen, Peter C. Brewer
