

College Students Weekly Earnings in Dollars (n = 5) (a) Make an Excel scatter plot. What does
Question:
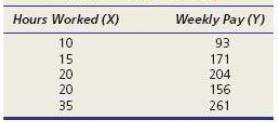
(a) Make an Excel scatter plot. What does it suggest about the population correlation between X and Y?
(b) Make an Excel worksheet to calculate SSxx, SSyy, and SSxy. Use these sums to calculate the sample correlation coefficient. Check your work by using Excel's function = CORREL (array1,array2).
(c) Use Appendix D to find t.025 for a two-tailed test for zero correlation at α =.05.
(d) Calculate the t test statistic. Can you reject Ï = 0?
(e) Use Excel's function = T.DIST.2T (t,deg_freedom) to calculate the two-tail p-value.
Fantastic news! We've Found the answer you've been seeking!
Step by Step Answer:
a The scatter plot shows a positive correlation between hours ...View the full answer

Answered By
Khurram shahzad
I am an experienced tutor and have more than 7 years’ experience in the field of tutoring. My areas of expertise are Technology, statistics tasks I also tutor in Social Sciences, Humanities, Marketing, Project Management, Geology, Earth Sciences, Life Sciences, Computer Sciences, Physics, Psychology, Law Engineering, Media Studies, IR and many others.
I have been writing blogs, Tech news article, and listicles for American and UK based websites.
5+ Reviews
17+ Question Solved
Related Book For 

Applied Statistics In Business And Economics
ISBN: 9780073521480
4th Edition
Authors: David Doane, Lori Seward
Question Posted:
