

Question: Compute the missing values for the following chart and analyze the financial performance and position of this company. The first year of operations is2005. 2011
Compute the missing values for the following chart and analyze the financial performance and position of this company. The first year of operations is2005.
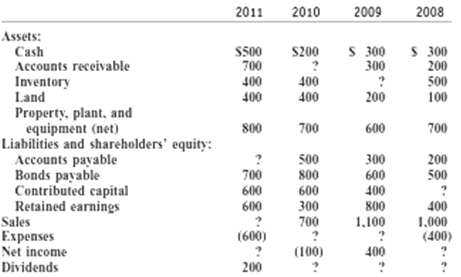
2011 2010 2009 2008 Assets: S 300 300 S 300 200 500 Cash Accounts receivable Inventory Land S500 700 400 400 S200 400 200 400 100 Property, plant, and equipment (net) Liabilities and shareholders' equity: Accounts payable Bonds payable Contributed capital Retained earnings Sales Expenses Net income Dividends 800 600 700 700 300 600 500 800 600 300 700 200 500 700 600 400 600 800 400 1,100 1.000 (400) (600) (100) 400 200
Step by Step Solution
3.36 Rating (180 Votes )
There are 3 Steps involved in it
2008 Contributed Capital Total assets Total liabilities Total stockholders equity 300 200 500 100 700 200 500 Contributed cap 400 Contributed capital ... View full answer

Get step-by-step solutions from verified subject matter experts
Document Format (1 attachment)
61-B-A-A-C (355).docx
120 KBs Word File