

A paper by R. N. Rodriguez (Health Care Applications of Statistical Process Control: Examples Using the SAS
Question:
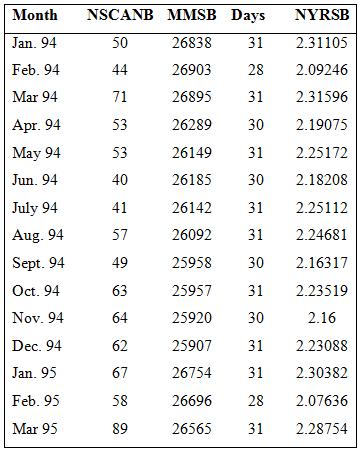
A paper by R. N. Rodriguez (“Health Care Applications of Statistical Process Control: Examples Using the SAS® System,” SAS Users Group International: Proceedings of the 21st Annual Conference,1996) illustrated several informative applications of control charts to the health care environment. One of these showed how a control chart was employed to analyze the rate of CAT scans performed each month at a clinic. The data used in this example are shown in Table 6E.16.  is the number of CAT scans performed each month and
 ![]() is the number of members enrolled in the health care plan each month, in units of member months. “Days” is the number of days in each month. The variable
is the number of members enrolled in the health care plan each month, in units of member months. “Days” is the number of days in each month. The variable  converts
 ![]() to units of thousand members per year, and is computed as follows:
to units of thousand members per year, and is computed as follows:  (days/30)/12000.
  represents the “area of opportunity.”
Construct an appropriate control chart to monitor the rate at which CAT scans are performed at this clinic.
Step by Step Answer:
The variable can be thought of as an inspection unit ...View the full answer


Managing Controlling and Improving Quality
ISBN: 978-0471697916
1st edition
Authors: Douglas C. Montgomery, Cheryl L. Jennings, Michele E. Pfund
