

Create an influence diagram for the politicians decision in Figure 3.25 using PrecisionTree. Include the tables showing
Question:
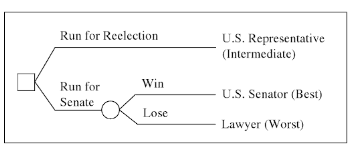
Create an influence diagram for the politician’s decision in Figure 3.25 using PrecisionTree. Include the tables showing decision alternatives, chance-event outcomes, and consequences.
Fantastic news! We've Found the answer you've been seeking!
Step by Step Answer:
The outcome of the Win Senate event is vacuous if the decision is made to run for ...View the full answer

Answered By
Fahmin Arakkal
Tutoring and Contributing expert question and answers to teachers and students.
Primarily oversees the Heat and Mass Transfer contents presented on websites and blogs.
Responsible for Creating, Editing, Updating all contents related Chemical Engineering in
latex language
8+ Reviews
22+ Question Solved
Related Book For 

Making Hard Decisions with decision tools
ISBN: 978-0538797573
3rd edition
Authors: Robert Clemen, Terence Reilly
Question Posted:
