

Data dont always arrive in the most convenient form. You may have the data, but theyre not
Question:
Data don’t always arrive in the most convenient form. You may have the data, but they’re not in the same place or the same format. Unless you have data organized in a common data table, you’ll find it hard or impossible to get the answers you need.7
For this exercise, you must prepare the data that are needed to explore the relationship between the sales of a company, retailer Best Buy, and the health of the economy. Is there a relationship between the amount of money available to be spent, called the disposable income, and the net sales of retailer Best Buy?
The economic data come from the online repository hosted by the Federal Reserve Bank of St. Louis. The data are collected monthly, are reported in the number of bil-lions of dollars (at an annual rate), and date back to 1959. The data for 2010 are as shown in the following table
Month Disp Income
2010-01-01………… $10,958.0
2010-02-01………… $10,983.3
2010-03-01………… $11,032.6
2010-04-01………… $11,108.1
2010-05-01………… $11,166.0
2010-06-01………… $11,176.6
2010-07-01………… $11,208.5
2010-08-01………… $11,258.5
2010-09-01………… $11,254.2
2010-10-01………… $11,310.9
2010-11-01………… $11,321.9
2010-12-01………… $11,377.3
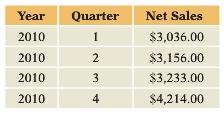
The data for Best Buy come from another source. CompuStat maintains a database of company information gleaned from reports that are required of all publicly traded frms. For a company to have its stock bought and sold, it must report data such as these quarterly net sales figures, given in millions of dollars. The sales data extend back to 2005 (only one year is shown).
Motivation
(a) Explain why it would it be useful to merge these two data tables. What questions do you think would be interesting to answer based on the merged information?
Method
(b) Describe the difference in interpretation of a row in the two tables. Do the tables have a common frequency?
(c) The separate data tables each have a numerical column of sales or income. Are the units of these comparable, or should they be expressed with common scales?
Mechanics
(d) What should you do if you want to arrange the data in a table that has a quarterly time frequency? Can you copy the data columns directly, or do you have to perform some aggregation or recoding frst?
(e) Suggest improved names for the columns in the merged data table. How do you want to represent the information about the date?
(f) Show the merged data table for 2010.
Message
(g) With the data merged, what familiar annual shopping ritual becomes apparent?
Step by Step Answer:
Motivation a Resemble the following By merging the data we can see how sales of Best Buy move along ...View the full answer


Statistics For Business Decision Making And Analysis
ISBN: 9780321890269
2nd Edition
Authors: Robert Stine, Dean Foster
