

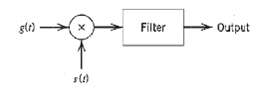
Figure shows the block diagram of a real-time spectrum analyzer working on the principle of frequency modulation.
Question:
Figure shows the block diagram of a real-time spectrum analyzer working on the principle of frequency modulation. The given signal g (t) and a frequency-modulated signal s (t) are applied to a multiplier and the output g (t) s (t) is fed into a filter of impulse response b (t). The s (t) is linear FM signals whose instantaneous frequencies vary linearly with time at opposite rates, as shown by s (t) = cos (2??ct ? ?kt2), b (t) = cos (2??ct + ?kt2), where k is a constant. Show that the envelope of the filter output is proportional to the magnitude spectrum of the input signal g (t) with kt playing the role of frequency ?.
Fantastic news! We've Found the answer you've been seeking!
Step by Step Answer:
The filter input is v t gt st gt cos2nft kt The complex env...View the full answer

Answered By
Utsab mitra
I have the expertise to deliver these subjects to college and higher-level students. The services would involve only solving assignments, homework help, and others.
I have experience in delivering these subjects for the last 6 years on a freelancing basis in different companies around the globe. I am CMA certified and CGMA UK. I have professional experience of 18 years in the industry involved in the manufacturing company and IT implementation experience of over 12 years.
I have delivered this help to students effortlessly, which is essential to give the students a good grade in their studies.
2+ Reviews
10+ Question Solved
Related Book For 
Question Posted:
