

Figure shows the idealized spectrum of a message signal m (t). The signal is sampled at a
Question:
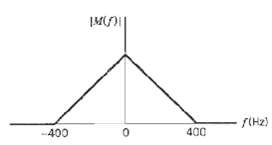
Figure shows the idealized spectrum of a message signal m (t). The signal is sampled at a rate equal to 1 kHz using flat-top pulses, with each pulse being of unit amplitude and duration 0.1 ms. Determine and sketch the spectrum of the resulting PAM signal
Fantastic news! We've Found the answer you've been seeking!
Step by Step Answer:
The spectrum of the flattop pulses is given by Hf Tsinc fr expjT 1...View the full answer

Answered By
Mohammad Danish Akhtar
I am teaching mathematics to 11th and 12th std. students specially preparing for competitive exams like Olympiad, IIT etc. I am co-author of two books one is of Calculus and another is of Algebra.
0 Reviews
10+ Question Solved
Related Book For 

Question Posted:
