

For a sample of 20 New England cities, a sociologist studies the crime rate in each city
Question:
For a sample of 20 New England cities, a sociologist studies the crime rate in each city (crimes per 100,000 residents) as a function of its poverty rate (in %) and its median income (in $1,000s). A portion of the regression results is shown in the accompanying table.
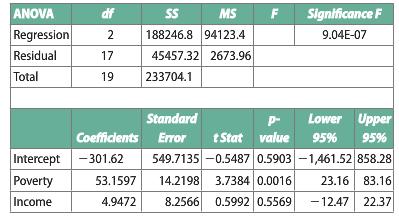
a. Specify the sample regression equation.
b. At the 5% significance level, show whether the poverty rate and the crime rate are linearly related.
c. Construct the 95% confidence interval for the slope coefficient of income. Using the confidence interval, determine whether income is significant in explaining the crime rate at the 5% significance level.
d. At the 5% significance level, are the poverty rate and income jointly significant in explaining the crime rate?
Step by Step Answer:
a b The reported p value associated with Poverty is equal to 00016 ...View the full answer


Essentials Of Business Statistics Communicating With Numbers
ISBN: 9780078020544
1st Edition
Authors: Sanjiv Jaggia, Alison Kelly
