

From Exercise 9: The table below shows the proportion of seat belts users by location (urban, suburban,
Question:
From Exercise 9: The table below shows the proportion of seat belts users by location (urban, suburban, and rural) for automobile passengers/ drivers in the US based on a survey done for the National Highway Traffic Safety Administration (DOT HS 809 557). Sample sizes are as shown in the right-hand column of the table.
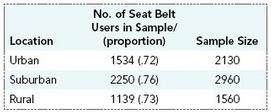
Use the appropriate table format to test the hypothesis that the proportion of seat belt users is the same for the driver/ passenger populations in all three locations— urban, suburban, and rural. Use a significance level of 10%.
Fantastic news! We've Found the answer you've been seeking!
Step by Step Answer:
OBSERVED FREQUENCIES Location Seatbelt No Seatbelt TOTAL Urban 722130 1533 597 2130 Suburban 762960 ...View the full answer

Answered By
Mwangi Clement
I am a tried and tested custom essay writer with over five years of excellent essay writing. In my years as a custom essay writer, I have completed more than 2,000 custom essays in a diverse set of subjects. When you order essays from me, you are working with one of the best paper writers on the web. One of the most common questions I get from customers is: “can you write my essay?” Upon hearing that request, my goal is to provide the best essays and overall essay help available on the web. I have worked on papers in subjects such as Nursing and Healthcare, English Literature, Sociology, Philosophy, Psychology, Education, Religious Studies, Business, Biological Sciences, Communications and Media, Physical Sciences, Marketing and many others. In these fields, my specialties lie in crafting professional standard custom writings. These include, but are not limited to: research papers, coursework, assignments, term papers, capstone papers, reviews, summaries, critiques, proofreading and editing, and any other college essays.
My extensive custom writings experience has equipped me with a set of skills, research abilities and a broad knowledge base that allows me to navigate diverse paper requirements while keeping my promise of quality. Furthermore, I have also garnered excellent mastery of paper formatting, grammar, and other relevant elements. When a customer asks me to write their essay, I will do my best to provide the best essay writing service possible. I have satisfactorily offered my essay writing services for High School, Diploma, Bachelors, Masters and Ph.D. clients.
I believe quality, affordability, flexibility, and punctuality are the principal reasons as to why I have risen among the best writers on this platform. I deliver 100% original papers that pass all plagiarism check tests (Turnitin, Copyscape, etc.). My rates for all papers are relatively affordable to ensure my clients get quality essay writing services at reasonable prices.
5+ Reviews
14+ Question Solved
Related Book For 

Understanding Business Statistics
ISBN: 978-1118145258
1st edition
Authors: Stacey Jones, Tim Bergquist, Ned Freed
Question Posted:
