

Here is a histogram of the monthly CPI as reported by the Bureau of Labor Statistics (ftp://ftp.bls.gov/pub/special.requests/cpi/cpiai.txt)
Question:
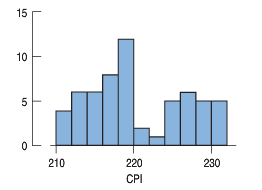
Here is a histogram of the monthly CPI as reported by the Bureau of Labor Statistics (ftp://ftp.bls.gov/pub/special.requests/cpi/cpiai.txt) from 2008 through 2012:
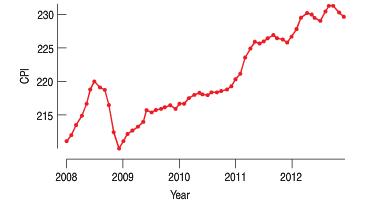
Here is the time series plot for the same data.
a) What features of the data can you see in the histogram that aren€™t clear from the time series plot?
b) What features of the data can you see in the time series plot that aren€™t clear in the histogram?
c) Which graphical display seems the more appropriate for these data? Explain.
d) Write a brief description of monthly CPI over this time period.
Fantastic news! We've Found the answer you've been seeking!
Step by Step Answer:
a The distribution of CPI is bimodal with one mode below 220 and the other at about 225 b T...View the full answer

Answered By
Talha Talib
I am a member of IEEE society. As i am a student of electrical engineering badge 17 but beside of this i am also a tutor in unique academy. I teach calculus, communication skills, mechanics and economics. I am also a home tutor. My student Muhammad Salman Alvi is a brilliant A-level student and he performs very well in academics when i start to teach him. His weak point was mathematics but now he is performing well in mathematics. I am a scholarship holder in Fsc as i scored 1017 marks in metric out of 1100. Later on i got scholarship in Punjab Group of Colleges. I got 2nd position in robotics competition in 2018 as my project home automation select for the exhibition in Expocentre.
23+ Reviews
62+ Question Solved
Related Book For 

Business Statistics
ISBN: 9780321925831
3rd Edition
Authors: Norean Sharpe, Richard Veaux, Paul Velleman
Question Posted:
