

In 1979, Nashua Corporation, with an increasing awareness of the importance of always maintaining and improving quality,
Question:
In 1979, Nashua Corporation, with an increasing awareness of the importance of always maintaining and improving quality, invited Dr. W. Edwards Deming for a visit and a consultation. Dr. Deming, then almost 80 years old, was the most sought-after quality guru in the United States.
Following many suggestions by Deming, Nashua hired Dr. Lloyd S. Nelson the following year as director of statistical methods. The idea was to teach everyone at the company about quality and how it can be maintained and improved by using statistics.
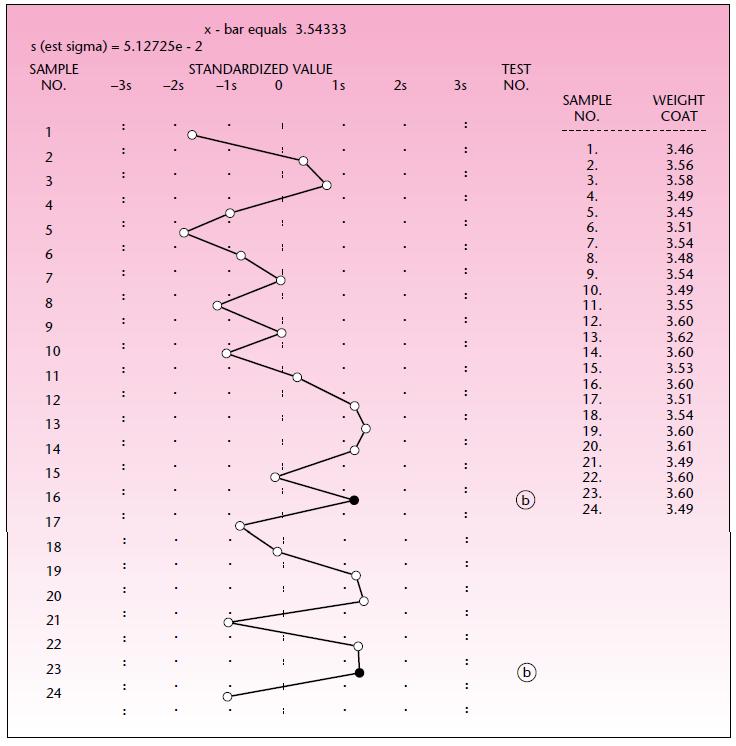
Dr. Nelson instituted various courses and workshops lasting 4 to 10 weeks for all the employees. Workers on the shop floor became familiar with statistical process control (SPC) charts and their use in maintaining and improving quality. Nashua uses individual x charts as well as x̄, R, and p charts. These are among the most commonly used SPC charts today. Here we will consider the x chart. This chart is used when values come slowly, as in the following example, and taking the time to form the subgroups necessary for an x̄ or R chart is not practical.
Among the many products Nashua makes is thermally responsive paper, which is used in printers and recording instruments. The paper is coated with a chemical mixture that is sensitive to heat, thus producing marks in a printer or instrument when heat is applied by a print head or stylus. The variable of interest is the amount of material coated on the paper (the weight coat). Large rolls, some as long as 35,000 feet, are coated, and samples are taken from the ends of the rolls.
A template 12 X 18 inches is used in cutting through four layers of the paper—first from an area that was coated and second from an uncoated area. A gravimetric comparison of the coated and uncoated samples gives four measurements of the weight coat. The average of these is the individual x value for that roll.
Assume that 12 rolls are coated per shift and that each roll is tested as described above. For two shifts, the 24 values of weight coat, in pounds per 3,000 square feet, were
3.46, 3.56, 3.58, 3.49, 3.45, 3.51, 3.54, 3.48, 3.54, 3.49, 3.55, 3.60, 3.62, 3.60, 3.53, 3.60, 3.51, 3.54, 3.60, 3.61, 3.49, 3.60, 3.60, 3.49.
Exhibit shows the individual control chart for this process, using all 24 values to calculate the limits. Is the production process in statistical control? Explain. Discuss any possible actions or solutions.
Step by Step Answer:
Quality Control and Improvement at Nashua Corporation Of the eight tests for an X chart ...View the full answer


Complete Business Statistics
ISBN: 9780077239695
7th Edition
Authors: Amir Aczel, Jayavel Sounderpandian
