

In the survey described in Exercise 32, student responses were also classified by year in college. The
Question:
In the survey described in Exercise 32, student responses were also classified by year in college. The table below shows the average time on the Internet for the sample of students in each of the class years, as reported in the study. Assume the standard deviations and sample sizes are as shown in the table.
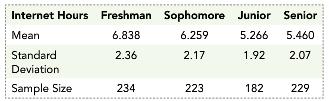
Use one-way analysis of variance to determine if there is sufficient sample evidence to reject a “no difference in population mean time on the Internet” null hypothesis at the 5% significance level.
Fantastic news! We've Found the answer you've been seeking!
Step by Step Answer:
H 0 1 2 3 4 the population means are equal H A The population means are not all equal Step 1 Compute ...View the full answer

Answered By
Ali Khawaja
my expertise are as follows: financial accounting : - journal entries - financial statements including balance sheet, profit & loss account, cash flow statement & statement of changes in equity -consolidated statement of financial position. -ratio analysis -depreciation methods -accounting concepts -understanding and application of all international financial reporting standards (ifrs) -international accounting standards (ias) -etc business analysis : -business strategy -strategic choices -business processes -e-business -e-marketing -project management -finance -hrm financial management : -project appraisal -capital budgeting -net present value (npv) -internal rate of return (irr) -net present value(npv) -payback period -strategic position -strategic choices -information technology -project management -finance -human resource management auditing: -internal audit -external audit -substantive procedures -analytic procedures -designing and assessment of internal controls -developing the flow charts & data flow diagrams -audit reports -engagement letter -materiality economics: -micro -macro -game theory -econometric -mathematical application in economics -empirical macroeconomics -international trade -international political economy -monetary theory and policy -public economics ,business law, and all regarding commerce
1+ Reviews
10+ Question Solved
Related Book For 

Understanding Business Statistics
ISBN: 978-1118145258
1st edition
Authors: Stacey Jones, Tim Bergquist, Ned Freed
Question Posted:
