

It is possible to adapt some of the tools used in linear regression to certain nonlinear cases.
Question:
It is possible to adapt some of the tools used in linear regression to certain nonlinear cases. Suppose, for example, you wanted to link independent variable x to dependent variable y using the following data. The scatter diagram for the data is provided.
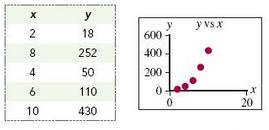
The data here appear to suggest a nonlinear relationship, perhaps a power function, connecting x to y. (A power function has the general form y = cxq, where c and q are constants.) To fit a power function, we could linearize the data by computing the natural log of the x and y values, then use linear regression to find the slope and the intercept of the least squares line that best fits the transformed data. The transformed data and the associated scatter diagram are shown below:
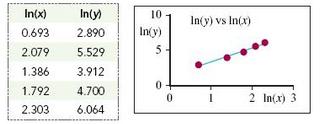
Taking the natural log of both sides of the y cx q equation gives ln(y) ln (c) + qln (x), showing ln (y) as a linear function of ln (x).
a. Find the least squares line that best describes the transformed data.
b. Report the appropriate c and q values for the associated power function.
c. Use the power function that you’ve identified to compute the expected value of y for x = 5. For x = 11.
Step by Step Answer:
x y lnx lny lnxxlny lnx 2 2 18 0693 2890 2003 0480 8 252 2079 5529 11498 4324 4 50 138...View the full answer


Understanding Business Statistics
ISBN: 978-1118145258
1st edition
Authors: Stacey Jones, Tim Bergquist, Ned Freed
