

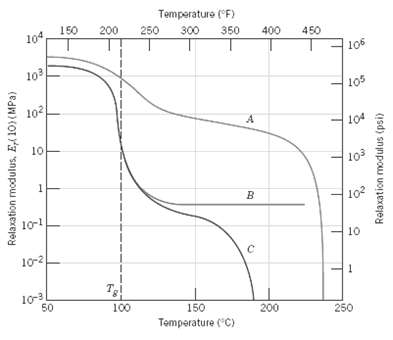
Make two schematic plots of the logarithm of relaxation modulus versus temperature for an amorphous polymer (curve
Question:
Make two schematic plots of the logarithm of relaxation modulus versus temperature for an amorphous polymer (curve C in Figure).
(a) On one of these plots demonstrate how the behavior changes with increasing molecular weight.
(b) On the other plot, indicate the change in behavior with increasing cross linking.
Fantastic news! We've Found the answer you've been seeking!
Step by Step Answer:
a This portion of the problem calls for a plot of log E r 1...View the full answer

Answered By
Charles mwangi
I am a postgraduate in chemistry (Industrial chemistry with management),with writing experience for more than 3 years.I have specialized in content development,questions,term papers and assignments.Majoring in chemistry,information science,management,human resource management,accounting,business law,marketing,psychology,excl expert ,education and engineering.I have tutored in other different platforms where my DNA includes three key aspects i.e,quality papers,timely and free from any academic malpractices.I frequently engage clients in each and every step to ensure quality service delivery.This is to ensure sustainability of the tutoring aspects as well as the credibility of the platform.
2+ Reviews
10+ Question Solved
Related Book For 
Fundamentals of Materials Science and Engineering An Integrated Approach
ISBN: 978-1118061602
4th Edition
Authors: David G. Rethwisch
Question Posted:
