

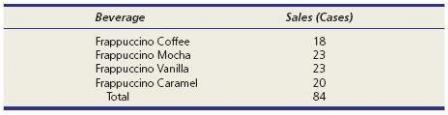
One-year sales volume of four similar 20-oz. beverages on a college campus is shown. (a) Make a
Question:
(a) Make a bar chart and describe it.
(b) Calculate expected frequencies for each class.
(c) Perform the chi-square test for a uniform distribution. At 5 .05, does this sample con- tradict the assumption that sales are the same for each beverage?
Fantastic news! We've Found the answer you've been seeking!
Step by Step Answer:
Vanilla and Mocha are the leading flavors Coffee least favori...View the full answer

Answered By
Muhammad Umair
I have done job as Embedded System Engineer for just four months but after it i have decided to open my own lab and to work on projects that i can launch my own product in market. I work on different softwares like Proteus, Mikroc to program Embedded Systems. My basic work is on Embedded Systems. I have skills in Autocad, Proteus, C++, C programming and i love to share these skills to other to enhance my knowledge too.
1+ Reviews
10+ Question Solved
Related Book For 

Applied Statistics In Business And Economics
ISBN: 9780073521480
4th Edition
Authors: David Doane, Lori Seward
Question Posted:
