

In a photoelectric-effect experiment, the maximum kinetic energy of the ejected photoelectrons is measured for various wavelengths
Question:
In a photoelectric-effect experiment, the maximum kinetic energy of the ejected photoelectrons is measured for various wavelengths of the incident light. Figure 38.35 shows a graph of this maximum kinetic energy, Kmax, as a function of the wavelength ? of the light falling on the surface of the metal. What are?(a) The threshold frequency and(b) The work function (in electron volts) for this metal?(c) Data from experiments like this are often graphed showing K max as a function of I/?, make a qualitative (no numbers) sketch of what this graph would look like. Identify the threshold wavelength (?0) on your sketch. What advantages are there to graphing the data this way?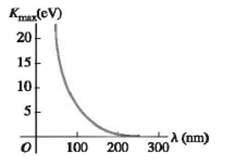
Fantastic news! We've Found the answer you've been seeking!
Step by Step Answer:
IDENTIFY In the photoelectric effect the energy of the photon is used to eject an ...View the full answer

Answered By
Charles mwangi
I am a postgraduate in chemistry (Industrial chemistry with management),with writing experience for more than 3 years.I have specialized in content development,questions,term papers and assignments.Majoring in chemistry,information science,management,human resource management,accounting,business law,marketing,psychology,excl expert ,education and engineering.I have tutored in other different platforms where my DNA includes three key aspects i.e,quality papers,timely and free from any academic malpractices.I frequently engage clients in each and every step to ensure quality service delivery.This is to ensure sustainability of the tutoring aspects as well as the credibility of the platform.
2+ Reviews
10+ Question Solved
Related Book For 

Physics for Scientists and Engineers A Strategic Approach with Modern Physics
ISBN: 978-0133942651
4th edition
Authors: Randall D. Knight
Question Posted:
