

Plot the data and show the least squares line and the corresponding estimated regression equation. Given the
Question:
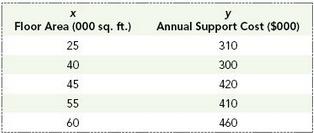
Plot the data and show the least squares line and the corresponding estimated regression equation. Given the line that you’ve drawn, about how much do support costs appear to increase with each 1000 square foot increase in floor area?
Benton University is planning to construct a new sports complex for use by its students. Beyond the cost of construction, support costs for things like staffing, heating, and general maintenance are of concern. As project manager, you are trying to identify a simple linear relationship that can be used to estimate the annual total of these costs. Below is a table showing support cost and floor area for some similar sports complexes in the region. You job is to use the data to see if you can establish a useful linear relationship between floor area and total annual support cost.
Step by Step Answer:
x y xy x 2 25 310 7750 625 40 300 12000 1600 45 420 18900 2025 55 410 2...View the full answer


Understanding Business Statistics
ISBN: 978-1118145258
1st edition
Authors: Stacey Jones, Tim Bergquist, Ned Freed
