

Plot the data and show the least squares line and the corresponding estimated regression equation. Given the
Question:
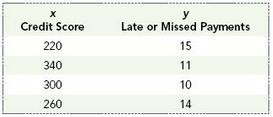
Plot the data and show the least squares line and the corresponding estimated regression equation. Given the line you’ve drawn, about how much does the number of late or missed payments appear to fall as credit score increases by 100 points?
Trenton Bank has a scoring system that it uses to evaluate new loan applications. You’ve been tracking the number of late or missed payments for a sample of “high risk” customers who received loans and have had scheduled payments over the past 60 months. The table below shows the number of late or missed payments and the credit scores for the four customers in the study.
Fantastic news! We've Found the answer you've been seeking!
Step by Step Answer:
x y xy x 2 220 15 3300 48400 340 11 3740 115600 300 10 3000 90000 2...View the full answer

Answered By
Stephen ouma
I have worked with different academic writing companies such as wriredom, writerbay, and Upwork. While working with these companies, I have helped thousands of students achieve their academic dreams. This is what I also intend to do here in SolutionInn
19+ Reviews
63+ Question Solved
Related Book For 

Understanding Business Statistics
ISBN: 978-1118145258
1st edition
Authors: Stacey Jones, Tim Bergquist, Ned Freed
Question Posted:
