

Professor Gill has taught general psychology for many years. During the semester, she gives three multiple-choice exams,
Question:
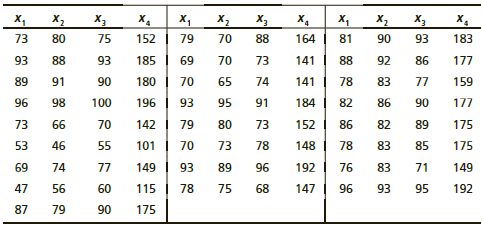
Professor Gill has taught general psychology for many years. During the semester, she gives three multiple-choice exams, each worth 100 points. At the end of the course, Dr. Gill gives a comprehensive final worth 200 points. Let x1, x2, and x3 represent a student’s scores on exams 1, 2, and 3, respectively. Let x4 represent the student’s score on the final exam. Last semester Dr. Gill had 25 students in her class. The student exam scores are shown on the next page.
(a) Generate summary statistics, including the mean and standard deviation of each variable. Compute the coefficient of variation (see Section 3.2) for each variable. Relative to its mean, which variable has the greatest spread of data values? Which variable has the smallest spread of data values relative to its mean?
(b) For each pair of variables, generate the sample correlation coefficient r. Compute the corresponding coefficient of determination r2, Which variable (other than x,) has the greatest influence (by itself) on x1? Would you say that both variables x2 and x3 show a strong influence on x,? Explain your answer. What percent of the variation in x1 can be explained by the corresponding variation in x2? Answer the same question for x3.
(c) Perform a regression analysis with x, as the response variable. Use x2 and as explanatory variables. Look at the coefficient of multiple determination. What percentage of the variation in x can be explained by the corresponding variations in 12 and x3 taken together?
(d) Look at the coefficients of the regression equation. Write out the regress ion equation. Explain how each coefficient can be thought of as a slope. If age was held fixed, but a person put on 10 pounds, what would you expect for the corresponding change in systolic blood pressure? If a person kept the same weight but got 10 years older, what would you expect for the corresponding change in systolic blood pressure?
(e) Test each coefficient in the regression equation to determine if it is zero or not zero. Use level of significance 5%. Why would the outcome of each hypothesis test help us decide whether or not a given variable should be used in the regression equation?
(f) Find a 90% confidence interval for each coefficient.
(g) This semester Susan has scores of 68, 72, and 75 on exams 1, 2, and 3, respectively. Make a prediction for Susan’s score on the final exam and find a 90% confidence interval for your prediction (if your software supports prediction intervals).
Step by Step Answer:
a Relative to its mean each exam had about the same spread of scores Yes it seems that all the exams ...View the full answer


Understandable Statistics Concepts And Methods
ISBN: 9781337119917
12th Edition
Authors: Charles Henry Brase, Corrinne Pellillo Brase
