

Recall from Exercise 14.32 (page 558) that Enterprise Industries has advertised Fresh liquid laundry detergent by using
Question:
Recall from Exercise 14.32 (page 558) that Enterprise Industries has advertised Fresh liquid laundry detergent by using three different advertising campaigns€”advertising campaign A (television commercials), advertising campaign B (a balanced mixture of television and radio commercials), and advertising campaign C (a balanced mixture of television, radio, newspaper, and magazine ads). To compare the effectiveness of these advertising campaigns, consider using two models, Model 1 and Model that are shown with corresponding partial Excel outputs in Figure on the next page. In these models y is demand for Fresh; x4 is the price difference; x3 is Enterprise Industries€™ advertising expenditure for Fresh; DA equals 1 if advertising campaign A is used in a sales period and 0 otherwise; DB equals 1 if advertising campaign B is used in a sales period and 0 otherwise; and DC equals 1 if advertising campaign C is used in a sales period and 0 otherwise. Moreover, in Model 1 the parameter β5 represents the effect on mean demand of advertising campaign B compared to advertising campaign A, and the parameter β6 represents the effect on mean demand of advertising campaign C compared to advertising campaign A. In Model 2 the parameter b 6 represents the effect on mean demand of advertising campaign C com-pared to advertising campaign B.
a. Compare advertising campaigns A, B, and C by finding 95 percent confidence intervals for ( 1) β5 and β6 in Model 1 and (2) β6 in Model 2. Interpret the intervals.
b. Using Model 1 or Model 2, a point prediction of Fresh demand when x4 = .20, x3 = 6.50, and campaign C will be used is 8.50068 (that is, 850,068 bottles). Show (by hand calculation) that Model 1 and Model 2 give the same point prediction.
c. Consider the alternative model
y = β0 + β1x4 + β2x3 + β3x23 + β4x4x3 + β5DB + β6DC + β7x3DB + β8x3DC + ε
which we call Model 3. The least squares point estimates of the model parameters and their associated p- values (given in parentheses) are as shown in Table 14.19 in the page margin. Let μ[d,a, A], μ[d, a, B], and μ[d,a,C] denote the mean demands for Fresh when the price difference is d, the advertising expenditure is a, and we use advertising campaigns A, B, and C, respectively. The model of this part implies that
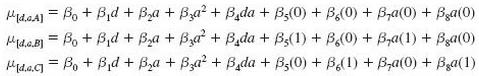
(1) Using these equations, verify that μ[d, a, C] €“ μ[d, a, A] equals β6 + β8a. (2) Using the least squares point estimates, show that a point estimate of μ[d, a, C] μ [d, a, A] equals .3266 when a 6.2 and equals .4080 when a 6.6. (3) Verify that μ [d, a, C] μ [d, a, B] equals β6 - β5 + β8a €“ β7a. (4) Using the least squares point estimates, show that a point estimate of μ [d, a, C] μ[d, a, B] equals .14266 when α = 6.2 and equals .18118 when α = 6.6. (5) Discuss why these results imply that the larger that advertising expenditure a is, then the larger is the improvement in mean sales that is obtained by using advertising campaign C rather than advertising campaign A or B.
d. If we use an Excel add-in (MegaStat), we can use Models 1, 2, and 3 to predict demand for Fresh in a future sales period when the price difference will be x4 = .20, the advertising expenditure will be x3 = 6.50, and campaign C will be used. The prediction results using Model 1 or Model 2 are given on the left below and the prediction results using Model 3 are given on the right below.
Which model gives the shortest 95 percent prediction interval for Fresh demand?
Step by Step Answer:
a 1 5 Model 1 b 5 02137 Confidence Interval 00851 03423 6 Model 1 b 6 03818 Confidence Interval 02551 05085 We have strong evidence that Campaigns B a...View the full answer


Essentials Of Business Statistics
ISBN: 9780078020537
5th Edition
Authors: Bruce Bowerman, Richard Connell, Emily Murphree, Burdeane Or
