

Reconsider Table 2-3 to explain why the simulated outcome in Table 2-4 is only about half as
Question:
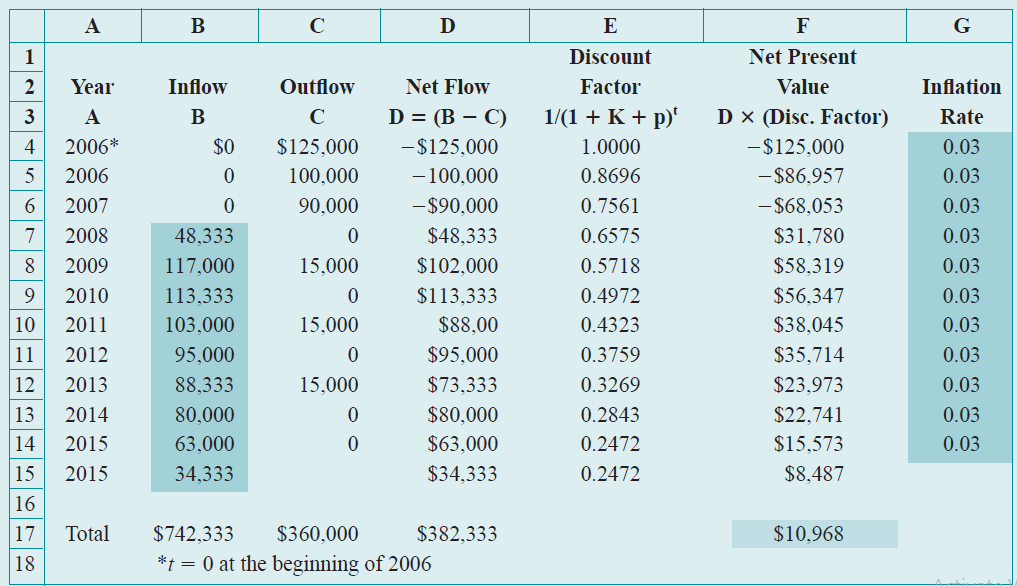
Reconsider Table 2-3 to explain why the simulated outcome in Table 2-4 is only about half as much as the value originally obtained in Table 2-2. Does the spread of the data in Table 2-3 appear realistic?
Fantastic news! We've Found the answer you've been seeking!
Step by Step Answer:
The original estimate was derived from the most likely values The distribution for each year ...View the full answer

Answered By
Muhammad Umair
I have done job as Embedded System Engineer for just four months but after it i have decided to open my own lab and to work on projects that i can launch my own product in market. I work on different softwares like Proteus, Mikroc to program Embedded Systems. My basic work is on Embedded Systems. I have skills in Autocad, Proteus, C++, C programming and i love to share these skills to other to enhance my knowledge too.
1+ Reviews
10+ Question Solved
Related Book For 

Project Management A Managerial Approach
ISBN: 978-0470226216
7th Edition
Authors: Jack R. Meredith, Samuel J. Mantel,
Question Posted:
