

Shown here is a sample of the times required to complete a full safety and structural inspection
Question:
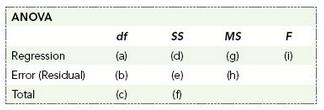
Shown here is a sample of the times required to complete a full safety and structural inspection of a Boeing 747 aircraft. The table gives the number of inspection team members (x) and the time, in hours, (y) it took for the team to complete its job in four recent inspections. You plan to use the data to determine whether there’s a useful linear relationship between the two variables.

Applying the least squares criterion has produced the estimated regression equation ŷ = 23.7 – .8x
a. Calculate the missing values in the ANOVA table below. SS regression (SSR) explained variation

SS error (SSE) unexplained variation

a. Calculate the missing t stat value and use it to determine whether we can reject a β = 0 null hypothesis at the 5% significance level.
b. Compare the t stat value that you computed in part a to the F value in Exercise 40. What is the general relationship between these two values?
Step by Step Answer:
Price unit x Units Sold y y 2 2 11 150 149 1 576 13 140 133 49 64 15 100 117 289 64 17 110 101 81 57...View the full answer


Understanding Business Statistics
ISBN: 978-1118145258
1st edition
Authors: Stacey Jones, Tim Bergquist, Ned Freed
