

Sigrids Custom Graphics specializes in creating and painting store window advertisement displays. The majority of its business
Question:
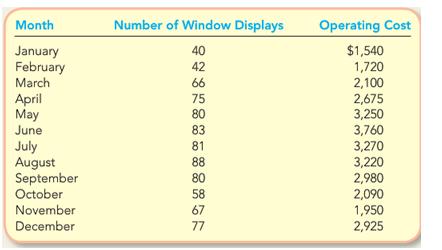
Sigrid’s Custom Graphics specializes in creating and painting store window advertisement displays. The majority of its business comes from local retailers and fast-food restaurants. A portion of Sigrid’s operating information for the past year follows:
Required:
1. Prepare a scatter graph of Sigrid’s operating cost and draw the line you believe best fits the data.
2. Based on this graph, estimate Sigrid’s total fixed costs per month.
3. Using the high-low method, calculate Sigrid’s total fixed operating costs and variable operating cost per window.
4. Using the high-low method results, calculate the expected operating cost for the business if it paints 96 windows.
5. Perform a least-squares regression analysis on Sigrid’s data.
6. Using the regression output, create a linear equation (y = a + bx ) for estimating Sigrid’s operating costs.
7. Using the least-squares regression results, calculate the store’s expected operating cost if it paints 96 windows.
Step by Step Answer:
Req 1 Req 2 Fixed costs appear to be about 250 Req 3 The highlow method should be based on th...View the full answer


Managerial Accounting
ISBN: 978-0078025518
2nd edition
Authors: Stacey Whitecotton, Robert Libby, Fred Phillips
