

Fit a simple linear regression model for the Galton dataset as seen in Example 4.5.1. Compare the
Question:
Fit a simple linear regression model for the Galton dataset as seen in Example 4.5.1. Compare the values of the regression coefficients of the linear regression model for this dataset with the previously obtained resistant line coefficients.
Data from in Example 4.5.1
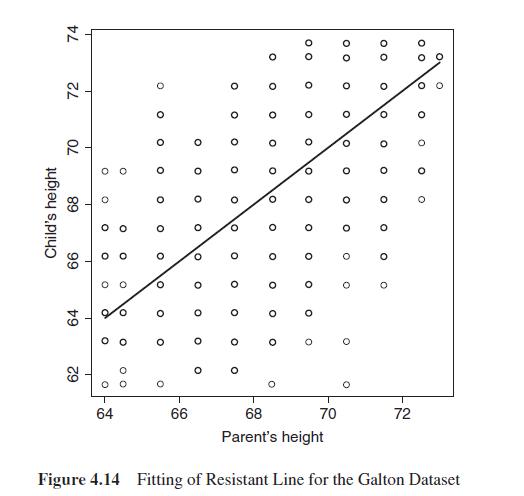
This dataset was used earlier as an example of an x-y plot. The scatter plot of the parents and the child reflected weak correlation in Figure 4.11, and now we examine and estimate the effect by using the resistant line model. The function resistant_line from the companion package will be used to build the model 4.11.
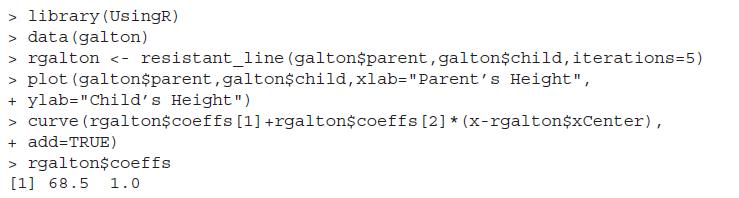
The fitted resistant line, see Figure 4.14, tells us that if the parents were taller by an inch, the child’s height would be more than an inch taller too.
For two factors, or covariates, an extension of the resistant line model 4.11, will be next considered.
Step by Step Answer:
The regression coefficients of the linear regression model for this dataset are 064 and ...View the full answer


A Course In Statistics With R
ISBN: 9781119152729
1st Edition
Authors: Prabhanjan N. Tattar, Suresh Ramaiah, B. G. Manjunath
