

Consider the spreading of a rumor through a company of 1000 employees, all working in the same
Question:
Consider the spreading of a rumor through a company of 1000 employees, all working in the same building. We assume that the spreading of a rumor is similar to the spreading of a contagious disease (see Example 3, Section 1.2) in that the number of people hearing the rumor each day is proportional to the product of the number who have heard the rumor previously and the number who have not heard the rumor. This is given by:
![]()
where k is a parameter that depends on how fast the rumor spreads and n is the number of days. Assume k = 0.001 and further assume that four people initially have heard the rumor. How soon will all 1000 employees have heard the rumor?
Data from example 3
Suppose that there are 400 students in a college dormitory and that one or more students has a severe case of the flu. Let in represent the number of infected students after n time periods.
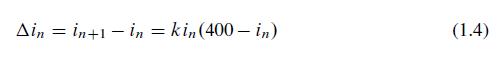
Assume that some interaction between those infected and those not infected is required to pass on the disease. If all are susceptible to the disease, then (400–in) represents those susceptible but not yet infected. If those infected remain contagious, we can model the change of those infected as a proportionality to the product of those infected by those susceptible but not yet infected, or
![]()
In this model the product in(400–in) represents the number of possible interactions between those infected and those not infected at time n. A fraction k of these interactions would cause additional infections, represented by Δin.
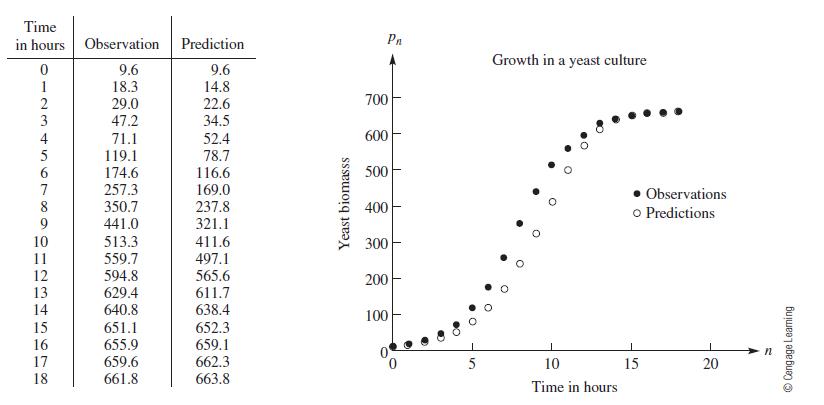
Equation (1.4) has the same form as Equation (1.2), but in the absence of any data we cannot determine a value for the proportionality constant k. Nevertheless, a graph of the predictions determined by Equation (1.4) would have the same S shape as the graph of the yeast population in Figure 1.10.
Equation 1.4
Equation 1.2
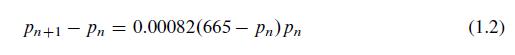
Figure 1.10
There are many refinements to this model. For example, we might assume that a segment of the population is not susceptible to the disease, that the infection period is limited, or that infected students are removed from the dorm to prevent interaction with the uninfected. More sophisticated models might even treat the infected and susceptible populations separately.
Step by Step Answer:
Between periods 8 and 9 there ...View the full answer


A First Course In Mathematical Modeling
ISBN: 9781285050904
5th Edition
Authors: Frank R. Giordano, William P. Fox, Steven B. Horton
