

From the data in Table 4.6, calculate the mean (i.e., the average) of the Bornstein errors V
Question:
From the data in Table 4.6, calculate the mean (i.e., the average) of the Bornstein errors ∣Vobserved – Vpredicted∣. What do the results suggest about the merit of the model?
Table 4.6
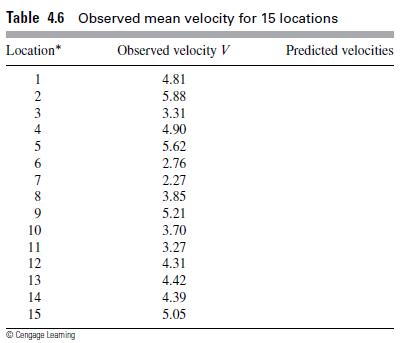
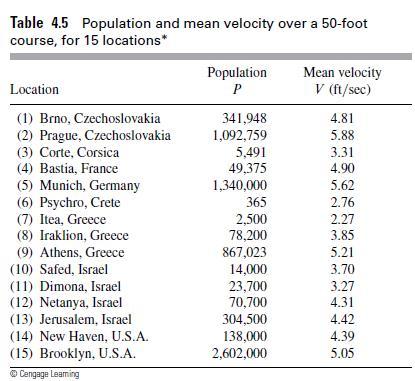
In 1976, Marc and Helen Bornstein studied the pace of life.2 To see if life becomes more hectic as the size of the city becomes larger, they systematically observed the mean time required for pedestrians to walk 50 feet on the main streets of their cities and towns. In Table 4.5, we present some of the data they collected. The variable P represents the population of the town or city, and the variable V represents the mean velocity of pedestrians walking the 50 feet. Problems 1-5 are based on the data in Table 4.5.
Table 4.5
Step by Step Answer:


A First Course In Mathematical Modeling
ISBN: 9781285050904
5th Edition
Authors: Frank R. Giordano, William P. Fox, Steven B. Horton
