

The following data represent the growth of a population of fruit flies over a 6-week period. Test
Question:
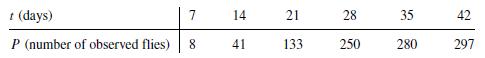
The following data represent the growth of a population of fruit flies over a 6-week period. Test the following models by plotting an appropriate set of data. Estimate the parameters of the following models.
a. P = c1t.
b. P = aebt.
Fantastic news! We've Found the answer you've been seeking!
Step by Step Answer:

Answered By
Utsab mitra
I have the expertise to deliver these subjects to college and higher-level students. The services would involve only solving assignments, homework help, and others.
I have experience in delivering these subjects for the last 6 years on a freelancing basis in different companies around the globe. I am CMA certified and CGMA UK. I have professional experience of 18 years in the industry involved in the manufacturing company and IT implementation experience of over 12 years.
I have delivered this help to students effortlessly, which is essential to give the students a good grade in their studies.
2+ Reviews
10+ Question Solved
Related Book For 

A First Course In Mathematical Modeling
ISBN: 9781285050904
5th Edition
Authors: Frank R. Giordano, William P. Fox, Steven B. Horton
Question Posted:
