

The following data represent the weight-lifting results from the 1976 Olympics. In Problems 6-12, construct a scatterplot
Question:
The following data represent the weight-lifting results from the 1976 Olympics.
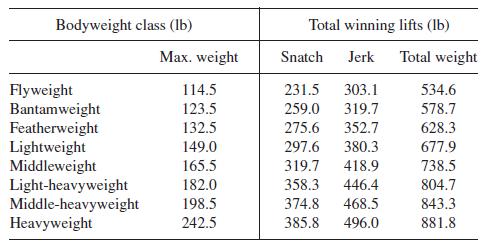
In Problems 6-12, construct a scatterplot of the given data. Is there a trend in the data? Are any of the data points outliers? Construct a divided difference table. Is smoothing with a low-order polynomial appropriate? If so, choose an appropriate polynomial and fit using the least-squares criterion of best fit. Analyze the goodness of fit by examining appropriate indicators and graphing the model, the data points, and the deviations.
Fantastic news! We've Found the answer you've been seeking!
Step by Step Answer:
To begin lets construct a scatterplot of the given data to visualize any potential trends and identi...View the full answer

Answered By
Evans Cherono
I am an Information Technology Graduate and willing to work on any computer science or IT work to ensure I do my best all the time.
2+ Reviews
10+ Question Solved
Related Book For 

A First Course In Mathematical Modeling
ISBN: 9781285050904
5th Edition
Authors: Frank R. Giordano, William P. Fox, Steven B. Horton
Question Posted:
