

The graph below was created using Stat Crunch with data obtained from the U.S. Bureau of Transportation
Question:
The graph below was created using Stat Crunch with data obtained from the U.S. Bureau of Transportation website (www.bts.gov). The graph shows the total vehicle production, in millions of vehicles, in the United States for the years 2010–2017.
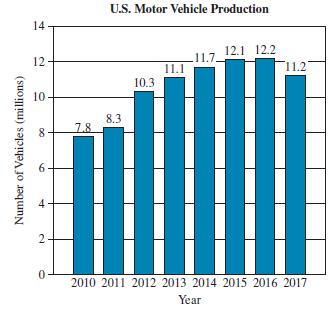
In which years was the number of vehicles produced
a) > 12 million?
b) < 11 million?
c) ≤ 10.3 million?
d) ≥ 11.7 million?
Fantastic news! We've Found the answer you've been seeking!
Step by Step Answer:
a 2015 2016 ...View the full answer

Answered By
Muhammad Mahtab
everyone looks that their work be perfect. I have more than a five year experience as a lecture in reputable institution, national and international. I provide perfect solution in marketing, case study, finance problems, blog writing, article writing, business plans, strategic management, human resource, operation management, power point presentation and lot of clients need. Here is right mentor who help clients in their multi-disciplinary needs.
3+ Reviews
14+ Question Solved
Related Book For 

A Survey Of Mathematics With Applications
ISBN: 9780135740460
11th Edition
Authors: Allen R. Angel, Christine D. Abbott, Dennis Runde
Question Posted:
