

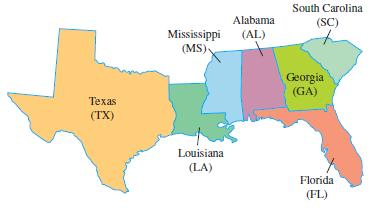
The maps of states that the Jugo family is planning to visit on future vacations are shown.
Question:
The maps of states that the Jugo family is planning to visit on future vacations are shown. Represent each map as a graph where each vertex represents a state and each edge represents a common border between the states. Use the state abbreviations to label the vertices of the graph.
Southeastern states
Fantastic news! We've Found the answer you've been seeking!
Step by Step Answer:
TX L...View the full answer

Answered By
Diane Joyce Pastorin
Please accept my enthusiastic application to solutioninn. I would love the opportunity to be a hardworking, passionate member of your tutoring program. As soon as I read the description of the program, I knew I was a well-qualified candidate for the position.
I have extensive tutoring experience in a variety of fields. I have tutored in English as well as Calculus. I have helped students learn to analyze literature, write essays, understand historical events, and graph parabolas. Your program requires that tutors be able to assist students in multiple subjects, and my experience would allow me to do just that.
You also state in your job posting that you require tutors that can work with students of all ages. As a summer camp counselor, I have experience working with preschool and kindergarten-age students. I have also tutored middle school students in reading, as well as college and high school students. Through these tutoring and counseling positions, I have learned how to best teach each age group.
2+ Reviews
10+ Question Solved
Related Book For 

A Survey Of Mathematics With Applications
ISBN: 9780135740460
11th Edition
Authors: Allen R. Angel, Christine D. Abbott, Dennis Runde
Question Posted:
