Choose two stocks from different industries that you think would have a low correlation. Get the closing
Question:
Choose two stocks from different industries that you think would have a low correlation. Get the closing prices for each month over the past five years for both stocks. To get the prices from Yahoo! Finance (https://finance.yahoo.com) follow the same procedure as was used in the Chapter 9 Internet Exercise to get the dividends, but this time select Historical Prices with Monthly frequency rather than Dividends Only. Download the data into Excel.
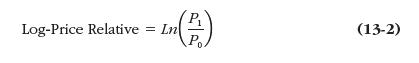
a. Calculate the returns for both stocks in each month during the five-year period using log-price relatives (see equation (13-2).
b. Calculate the average monthly return and standard deviation of monthly returns for each stock. Using only this information, which of the two stockswould you have preferred to own over this period?
c. Calculate the correlation coefficient for the two sets of returns using the Correl function. Is it as low as you expected?
d. If the historical returns, standard deviations, and correlation fairly represent the future, calculate the expected return and standard deviation of a portfolio consisting of 50% invested in each stock. How does the portfolio compare with the individual stocks?
e. Using the Solver, find the weights for each stock that would result in the minimum portfolio standard deviation.
Equation (13-2)
Data from Chapter 9 Internet Exercise.
Using the Yahoo! Finance Web site (https://finance.yahoo.com) get the current price and five-year dividend history for 3M Company. To gather this data, enter the ticker symbol (MMM) in the search box at the top of the page, and select 3m Company from the list. Record the current price from this page. Now, click on the Historical Data link. To get a table of previous dividends select Dividends Only in the Show list, set the Time Period to five years prior to today’s date, and click the Apply button. Click the Download Data link to download a file with this data. You may have the choice of either saving the file or opening it directly in Excel. It is easier to let it open in Excel. Otherwise, save the .csv (comma separated variables) file, and then open it with Excel. It shouldn’t need any further processing. You now have the dividends in a worksheet.
Step by Step Answer: