Suppose that on July 25, 2014 you purchased shares in Tesla Inc. (Nasdaq: TSLA). It is now
Question:
Suppose that on July 25, 2014 you purchased shares in Tesla Inc. (Nasdaq: TSLA). It is now five years later and you decide to evaluate your holdings to see if you have done well with this investment. The table below shows the end of July market prices of TSLA.
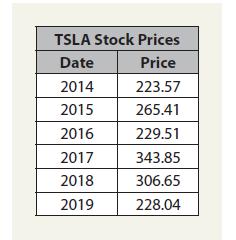
a. Enter the data into a worksheet and format the table as shown.
b. Add a new column and use a formula to calculate your rate of return for each year. Format the data as percentages with two decimal places.
c. Add another column and use a formula to calculate the cumulative total return from July 2014 to the end of July of each year. Format the data as above.
d. Calculate the total return for the five-year holding period. What is the compound average annual growth rate (CAGR) of your investment?
e. Create a Line chart showing the stock price from July 2014 to July 2019. Be sure to title the chart and label the axes. Now, create an XY Scatter chart of the same data. What are the differences between these types of charts? Which type of chart is more appropriate for this data?
f. Experiment with the formatting possibilities of the chart. For example, you might try changing it to a 3-D Line chart and fill the plot area with a marble background. Is there any reason to use this type of chart to display this data? Do the “enhancements” help you to understand the data?
Step by Step Answer:

This question has not been answered yet.
You can Ask your question!