

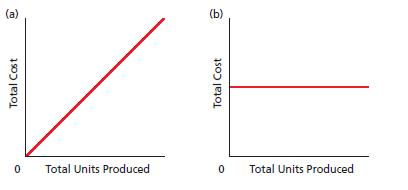
Which of the following graphs illustrates how total variable costs behave with changes in total units produced?
Question:
Which of the following graphs illustrates how total variable costs behave with changes in total units produced?
Fantastic news! We've Found the answer you've been seeking!
Step by Step Answer:
The graph that illustrates how total variable costs behave wi...View the full answer

Answered By
Muhammad Umair
I have done job as Embedded System Engineer for just four months but after it i have decided to open my own lab and to work on projects that i can launch my own product in market. I work on different softwares like Proteus, Mikroc to program Embedded Systems. My basic work is on Embedded Systems. I have skills in Autocad, Proteus, C++, C programming and i love to share these skills to other to enhance my knowledge too.
1+ Reviews
10+ Question Solved
Related Book For 

Accounting
ISBN: 978-0324401844
22nd Edition
Authors: Carl S. Warren, James M. Reeve, Jonathan E. Duchac
Question Posted:
