

During a decade of continuous drought, the water level of a lake has decreased by 10 percent
Question:
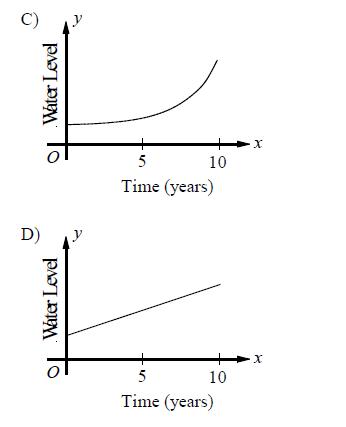
During a decade of continuous drought, the water level of a lake has decreased by 10 percent each year. Which of the following graphs could model the water level of the lake as a function of time?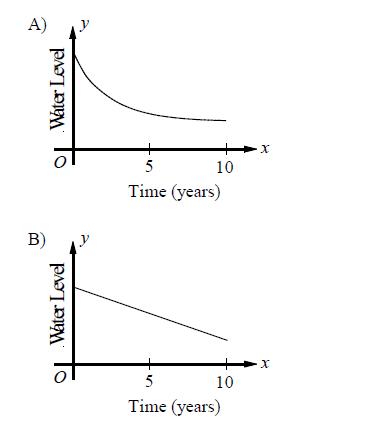
Fantastic news! We've Found the answer you've been seeking!
Step by Step Answer:
A Suppose the initial water level was 100 units If the wat...View the full answer

Answered By
Alex Chacko
I am Alex Chacko, a second year integrated Msc Chemistry student at Institute for intensive research in basic science (IIRBS).I have also been working as a question and answer expert with chegg for the past two years.I have been answering difficult questions for the past 2 years and hence i assure you to provide the best quality answer.
0 Reviews
10+ Question Solved
Related Book For 

Question Posted:
