

List A and List B each contains 30 numbers. Frequency distributions for each list are recorded in
Question:
List A and List B each contains 30 numbers. Frequency distributions for each list are recorded in the histograms below.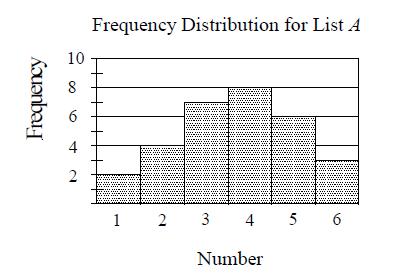
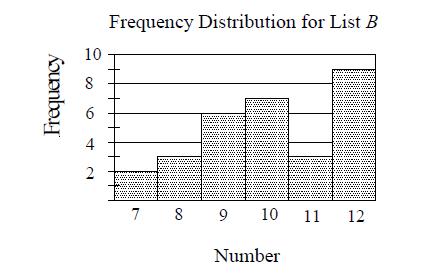
The average (arithmetic mean) of the numbers in list A is 3.7, and the average of the numbers in list B is 10.1. List C contains 60 numbers: the 30 numbers of list A and the 30 numbers of list B.
Which of the following is true about the two lists shown for the 30 numbers?
A) The standard deviation of the numbers in list A is larger.
B) The standard deviation of the numbers in list B is larger.
C) The standard deviation of the numbers in list A is the same as that of list B.
D) The standard deviation of the numbers in the two lists cannot be determined.
Fantastic news! We've Found the answer you've been seeking!
Step by Step Answer:
B The standard deviation is a measure of how far the data set values are from the mea...View the full answer

Answered By
Utsab mitra
I have the expertise to deliver these subjects to college and higher-level students. The services would involve only solving assignments, homework help, and others.
I have experience in delivering these subjects for the last 6 years on a freelancing basis in different companies around the globe. I am CMA certified and CGMA UK. I have professional experience of 18 years in the industry involved in the manufacturing company and IT implementation experience of over 12 years.
I have delivered this help to students effortlessly, which is essential to give the students a good grade in their studies.
2+ Reviews
10+ Question Solved
Related Book For 
Question Posted:
