

The line graph shows the enrollment for College R between 1950 and 2000. What is the average
Question:
The line graph shows the enrollment for College R between 1950 and 2000.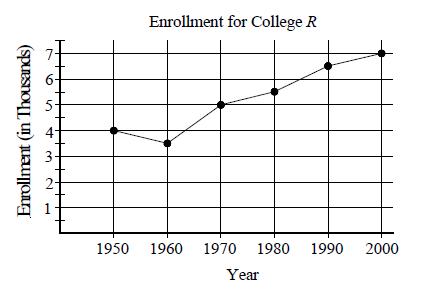 What is the average rate of increase in enrollment per decade between 1950 and 2000?
A) 500
B) 600
C) 750
D) 875
Fantastic news! We've Found the answer you've been seeking!
Step by Step Answer:
B Average rate of i...View the full answer

Answered By
Nandana Wijayarathna
I am a highly experienced writer in several areas,
Business management
Information technology
Business administration
Literature
Biology
Environmental science
History
161+ Reviews
399+ Question Solved
Related Book For 
Question Posted:
